Welcome. This article is a part of my research project, aiming to spot the linear dependencies between geometric structures as well as the stylic patterns of images. I aim to use this essay as a starting point to further explore algorithms that optimizes the reconstruction precision based on existing information.
By default, my website runs in dark mode, most of my articles uploaded here are also great to view in dark mode. However, it is recommended for this essay to use the light mode of the website, as the figures of essay are based on the white background. To enable the light mode, find the “sun” icon on the top left of website and click it.
Source Code
The essay’s code is written in Python. The key codes that generates the data as well as figures inside the article will be open-sourced at my GitHub soon. You will need Python 3.13.0 and corrosponding dependencies to run the codes, play and experiment them on your own.
There is a preview of the code here. Follow this link to view the code in another webpage .
Code is compiled in JupiterNotebook. For more instructions and dependencies list, see the documentations in the webpage.
Abstract
This article investigates the internal structural linear dependencies within handwritten digits using the MNIST dataset. Moving beyond traditional classification, we partition images spatially (top/bottom and left/right) and employ Principal Component Analysis (PCA) combined with Canonical Correlation Analysis (CCA) to quantify the geometric cohesion between distinct segments. Our results reveal that structural dependencies are concentrated in a few dominant modes.
Specifically, “curvilinear” digits (e.g., 0, 2, 5, 6, 8, 9) exhibit robust spatial stability, whereas “rectilinear” digits (e.g., 1, 4, 7) show less consistent dependencies that are highly sensitive to writing styles such as slant. Finally, we validate these findings through Linear Regression reconstruction, demonstrating how segmentation orientation fundamentally alters the nature of captured structural features.
1. Introduction
Handwritten digit recognition is a foundational problem in computer vision and machine learning. While traditional classification tasks focus on distinguishing between digits, we wish to investigate the structural dependencies within the digits themselves. A handwritten digit is not merely a collection of independent pixel intensities, it is a coherent geometric structure where the presence of ink in one region strongly predicts the presence of ink in another, as it is a combination of various topological structure as well as human’s writing preferences.
The goal of this project is to investigate these internal linear dependencies between parts of digits and understand the key component that determines spatial partitions of an image relate to one another respectively. We hypothesize that topological features, such as symmetries and closed loops inside ‘0’ or ‘8’, aligns consistently across different parts, while more rectangular digits like 4,7,1 will behave oppositely.
We will be employing Principal Component Analysis (PCA) to identify the dominant modes of variation and Canonical Correlation Analysis (CCA) to discover the linear relationship between spatially distinct image segments. In addition, we will also verify our conclusions by employing Linear Regression to reconstruct the image with a focus of disti
2. Data Description
The original MNIST dataset, also known as Modified National Institute of Standards and Technology dataset, consists of 70000 instances of handwritten digits.
Our dataset is sampled from the original MNIST dataset, consists of 5000 greyscale images of handwritten digits from 0 to 9, where each image has a resolution of 28x28 pixel that being flattened into a vector of 784 dimensions.
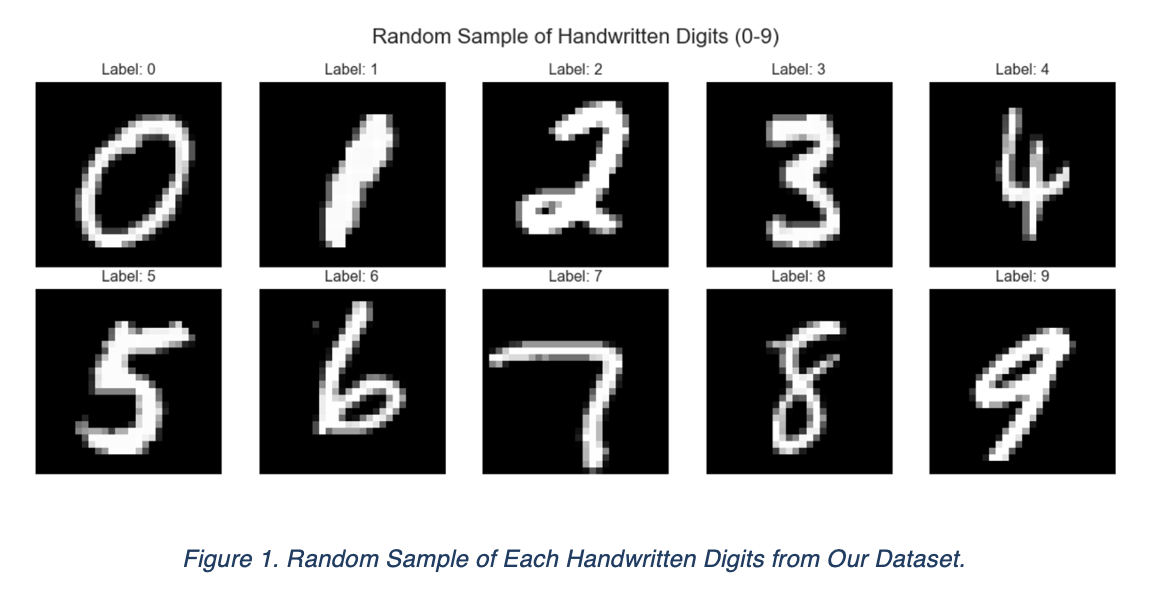
Figure 1 displays a random sample of digits from classes 0 through 9. We observe significant in-class variability in slant, thickness and topological structure such as loops, strokes and so on.
In our pre-processing step, we normalized the pixel intensity values by scaling them to a range of [0, 1] by dividing 255. This allows for a more intuitive visual interpretation of the principal components and reconstructed images.
3. Methodology
3.1. Overview of PCA, CCA and Linear Regression
PCA is used to find the feature that impacts the distinguishment of data the most, while CCA is designed to study the potential linear dependencies between two sets of variables. Their optimization goal is different, but they both work towards helping us investigate the symmetry and cohesion of digit structures.
Linear Regression model is then trained based on left / top split to further verify our results by reconstructing full image based on one part of its structure.
3.2. Experimental Design
For ease of explanation, only top PCA process and top/bottom CCA process will be demonstrated. Left and right follows the exact same principle.
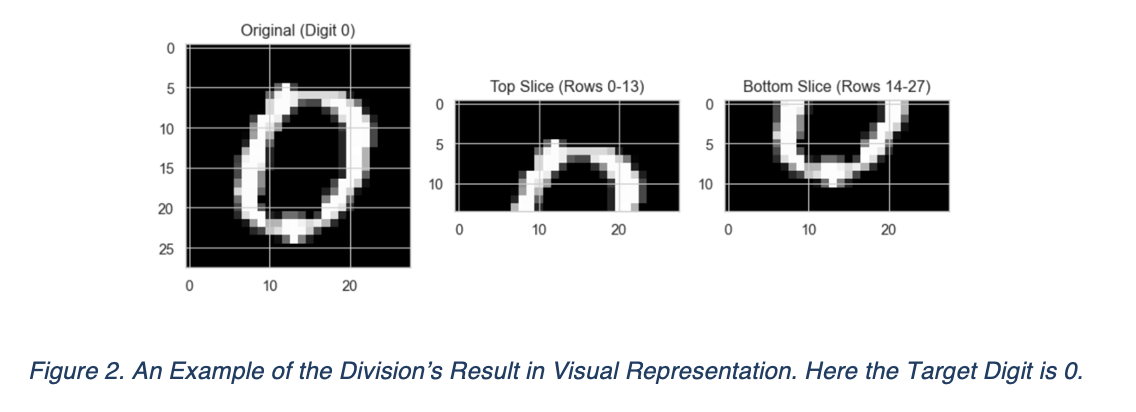
For a fixed digit from its $N=500$ samples, each sample is originally a $28 \times 28$ matrix. Partition each image at the $14^{\text{th}}$ row into two sub-matrices of size $14 \times 28$ representing top and bottom half of the original picture. An example of the results has been displayed in the following figure.
After we got our left and right data matrix, we first used PCA to find their own principal components, and we checked how significant that these eigenvectors can brought to the variance fluctuations. We found that with 20 PC, we can have around 80% explained variance for both horizontal view and vertical views, indicating that the redundancy of dimensions are significant. For sake of demonstration, we will only display two scree plots but the left and right looks similar.
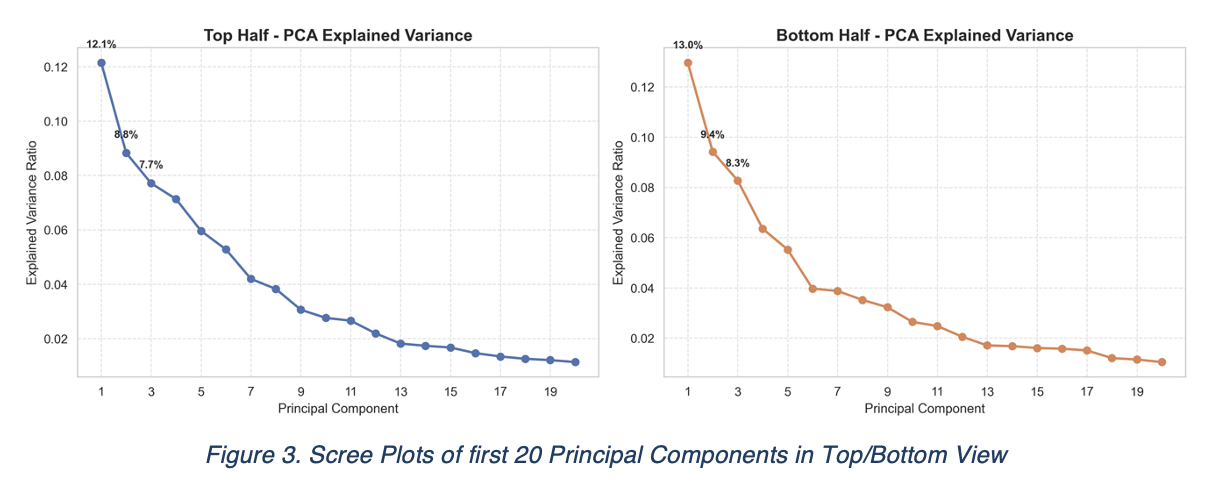
By balancing the effectiveness and preservation of information, we finally selected to use only 5 principal components to reduce the dimension and allow CCA to work effectively in a low dimensional space.
| Top | Bottom | Left | Right |
|---|---|---|---|
| 54.79% | 53.76% | 53.91% | 52.43% |
Table 1. Variance Explained by 5 Principal Components
These sub-matrices are then flattened to form the input vectors of 392 dimensions, a $1 \times 392$ matrix. This process is repeated to construct $X_{top}, X_{bot} \in \mathbb{R}^{500 \times 392}$.
PCA is then introduced to extract the dominant structural modes. We compute the top covariance matrix:
$$ \Sigma_{top} = \frac{1}{N-1} X_{top}^T X_{top} \in \mathbb{R}^{392 \times 392} $$Solving the eigenvalue problem $\Sigma_{top}v = \lambda v$ gives the eigenvectors. We select the top 5 eigenvectors corresponding to the largest eigenvalues to form the projection matrix $P_{top}$ such that: $P_{top} = [v_1, v_2, \ldots, v_5] \in \mathbb{R}^{392 \times 5}$.
Dimension reduced $Z_{top}$ is defined as follows:
$$ Z_{top} = X_{top} P_{top} \in \mathbb{R}^{500 \times 5} $$Obtaining $Z_{bot}$ following the same procedures, we begin the CCA process by seeking projection vectors $w_u$ and $w_v$ both in $\mathbb{R}^{5 \times 1}$ and construct $U$ and $V$ such that $U = Z_{top}w_u$ and $V = Z_{bot}w_v$. The optimization objective is:
$$ \max_{w_u, w_v} \rho(U, V) = \frac{w_u^T S_{tb} w_v}{\sqrt{w_u^T S_{tt} w_u} \sqrt{w_v^T S_{bb} w_v}} $$Where $S_{tt}, S_{bb}$, and $S_{tb}$ are the covariance and cross-covariance matrices of the latent features $Z$. yields the first canonical correlation coefficient $\rho$, which quantifies the strength of the association, and the corresponding canonical weight vectors $w_u$ and $w_v$, which represent the contribution of each principal component to this association.
Define $h_{top} = P_{top} w_u$ and $h_{bot} = P_{bot} w_v$. Reshaping $h_{top}$ and $h_{bot}$ from $\mathbb{R}^{392}$ into size of $14 \times 28$ and merge them vertically into a full $28 \times 28$ grid. The resulting matrix is visualized in the format of a heatmap, where red indicates positive correlation with the opposing half’s structure and blue indicates negative correlation. The strength of correlation is represented by the depth of color.
To rigorously evaluate the predictive capability of the linear dependencies and ensure the model’s generalizability, the dataset is partitioned into a training set ($N_{train}=450$) and a held-out testing set ($N_{test}=50$) per specific digit class. PCA models are fitted on the training data. Let $Z_S, Z_T \in \mathbb{R}^{N_{train} \times k}$ be the matrices of latent vectors, we seek a linear mapping matrix $W \in \mathbb{R}^{k \times k}$ that satisfies:
$$ \min_{W} \| Z_T - Z_S W \|_F^2 $$$W$ is then validated on the unseen testing samples. For a test instance, we project its source half to obtain the latent vector $z_{S,test}$. The predicted target latent vector is computed as $\widehat{z_{T,test}} = z_{S,test}W$. Finally, the high-dimensional reconstruction $\widehat{x_{T,test}}$ is obtained by projecting $\widehat{z_{T,test}}$ back using the target’s eigenvectors $V_T$ and adding the mean \mu_T$:
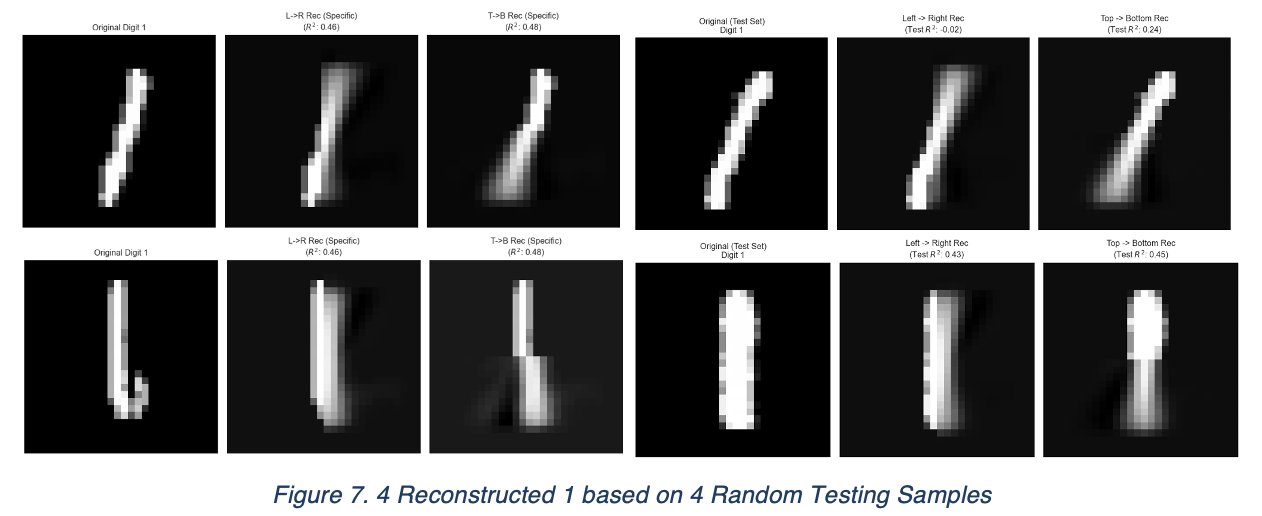
$$ \widehat{x_{T,test}} = \widehat{z_{T,test}} V_T + \mu_T $$Since our primary objective is to validate structural correlations rather than achieve high-fidelity reconstruction, the observed blurriness is expected. Given that projecting 784 dimensions down to just 5 constitutes a massive compression ratio, high-frequency details are naturally lost. The resulting reconstructed segments are then concatenated with the original source segments for visual comparison
4. Results Analysis
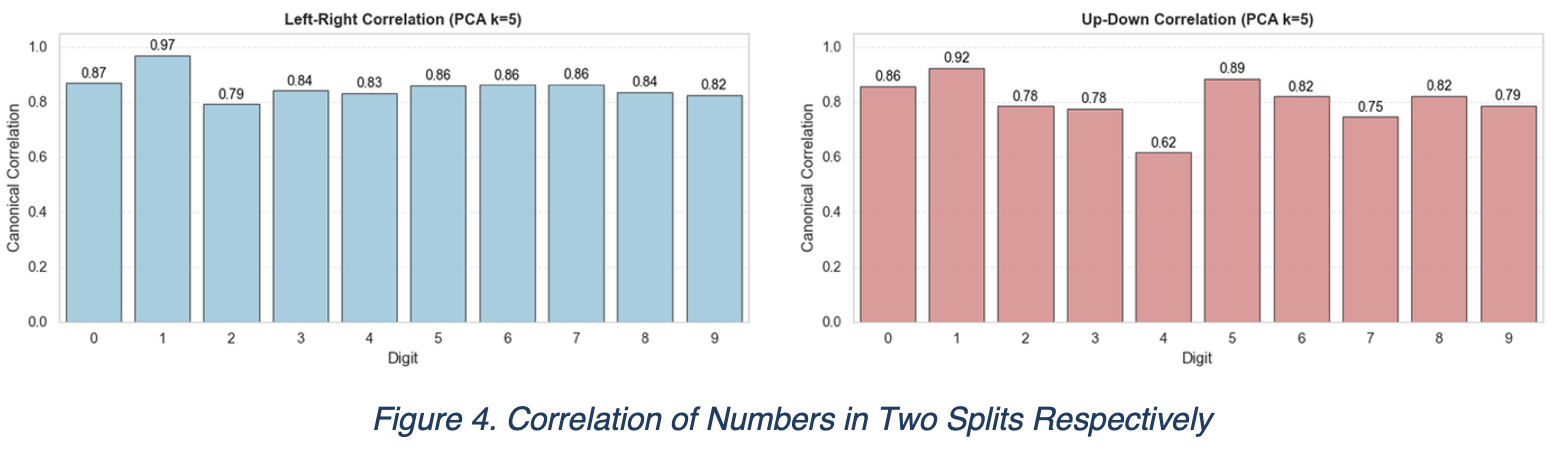
From the correlation plots as well as the output data, we found strong evidence that the linear dependency between numbers are strong on these 5 principal components.
The robustness of canonical correlations within a highly truncated principal subspace reveals that the geometric identity of handwritten digits is sparse. The structural dependency is not diffuse but concentrated in a few dominant modes of variation, effectively making the digit’s parts mutually predictive linear functions of each other.
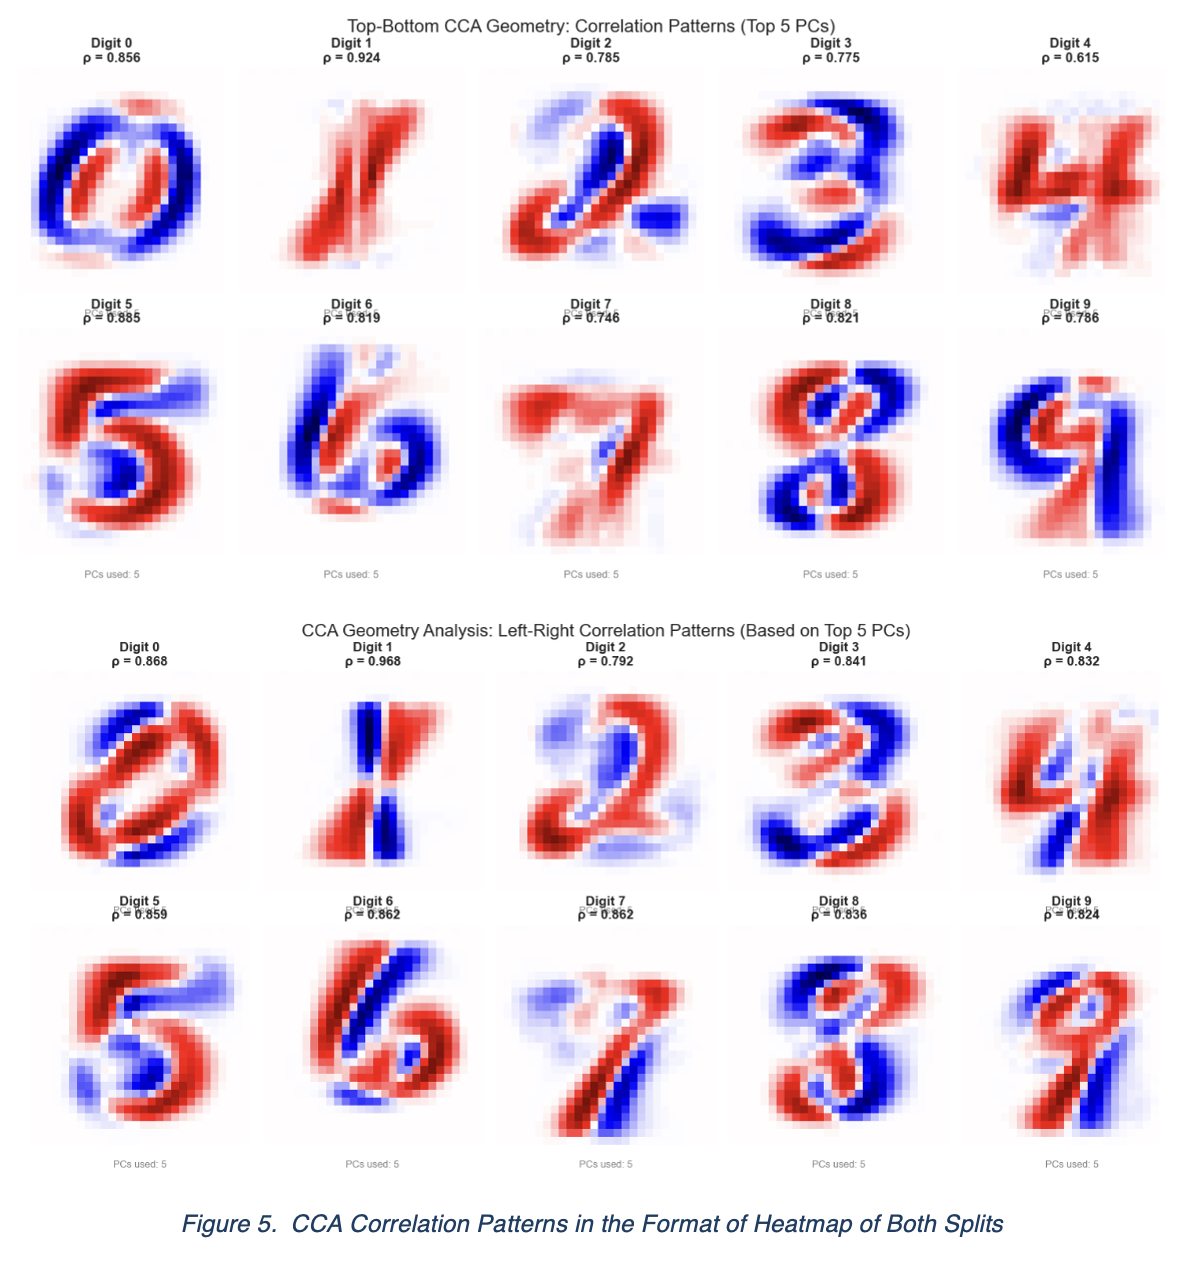
By inspecting the generated horizontal view and vertical view, we found the pattern of these digits displayed differently, despite of knowing the content of images comes from the same dataset.
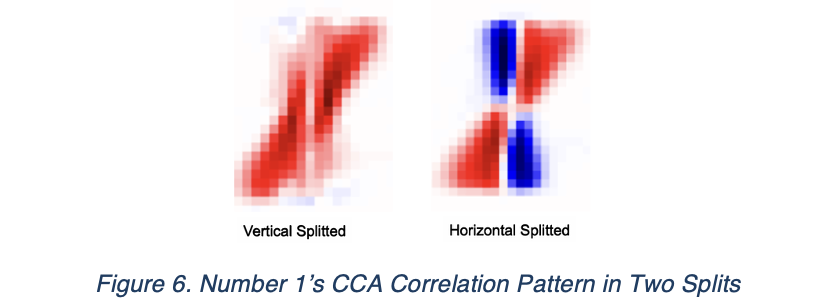
Although the difference is significant across all digits, We are particularly interested in the discrepancy observed in digit ‘1’. In the vertical view, it manifests as a purely red pattern, indicating a strong positive correlation driven by the digit’s tilt. Conversely, the horizontal view reveals two different possible writing of 1, which one of them is nearly vertical and the other is very similar to the vertical view.
Our linear regression graph further confirmed this discovery. Top split restored 1 has obtained “position shift” in both sample, while left/right has preserved better spatial position.
As 1 displayed the simplest geometrical structure, but the writing of 1s could varies across these 500 data samples, to investigate how the top and bottom relate together and reason why it differs from the relationship of right and left half, we traced back to the principal components of 1 in each part of four directions.
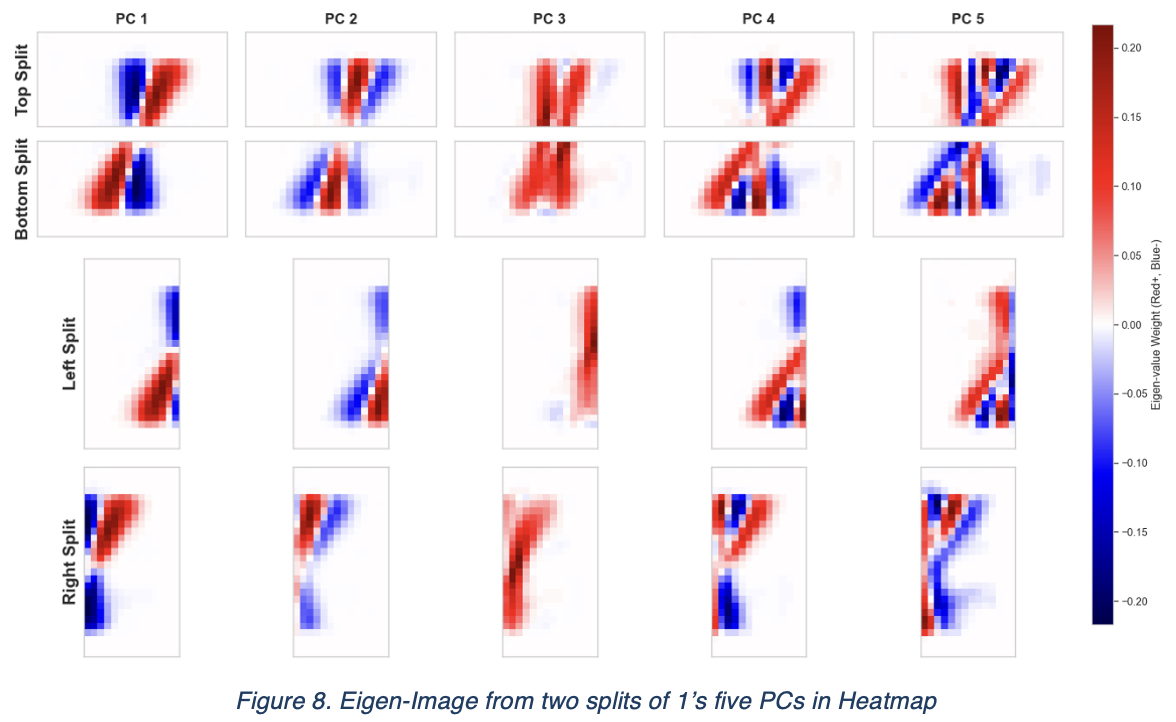
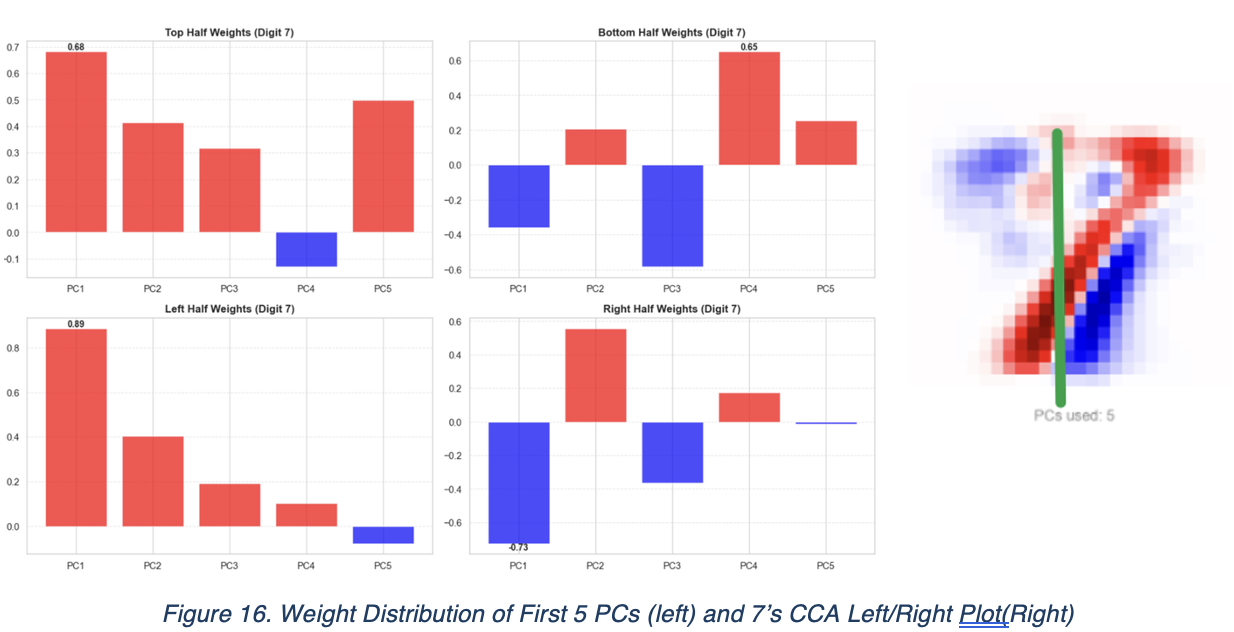
The eigen-images of first three principal components of 1 has shown clear and straight forward information about the information they contain. In context, PC1 stands for the spatial position of 1, PC2 stands for the thickness of writing, PC3 stands for the intensity of ink. We suspect that the dependencies of vertical set mostly depend on the PC3 and horizontal set mostly depends on the PC1. The next experiment we designed supports our hypothesis:
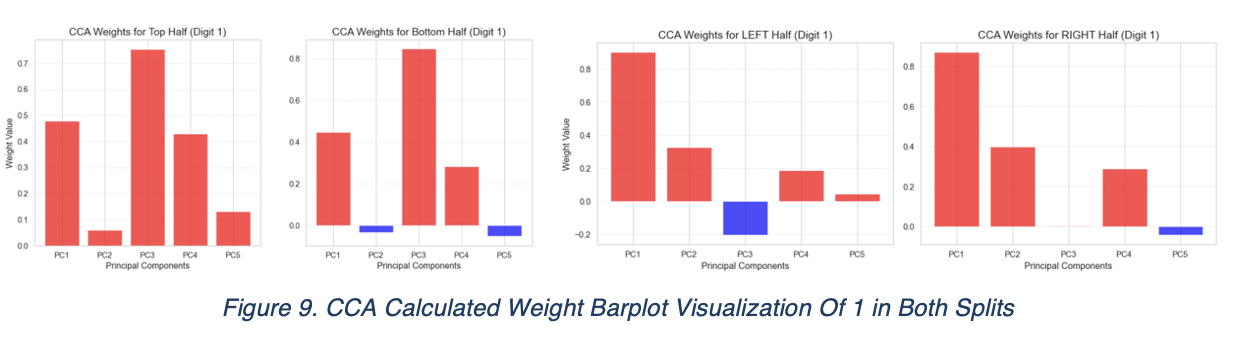
From the top/bottom CCA weight distributions, PC3 dominates across both upper and lower image. In contrast, PC1 dominates PC1 of both left/right image. To further confirm our discoveries, we begin to inspect 5 using the same process, as it represents an opposite trend of what we discovered on 1
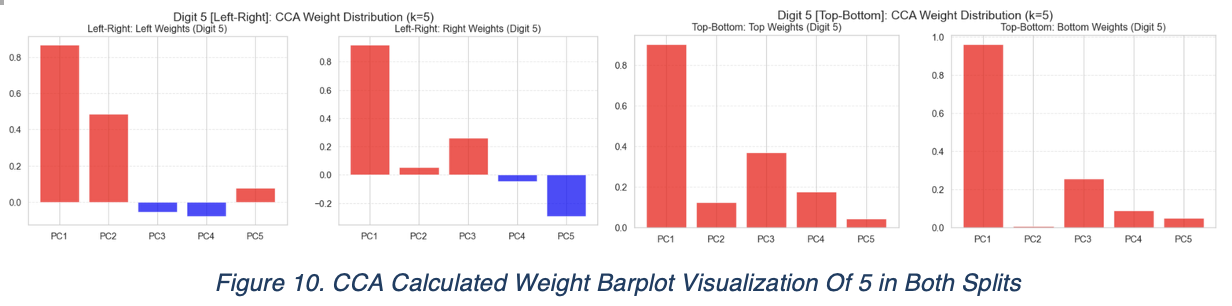
By inspecting the weight distribution again, all four images has PC1 as the dominant principle components. To reveal the PC1 of 5, we traced back to the PCA process of 5, and generated four eigen-images.
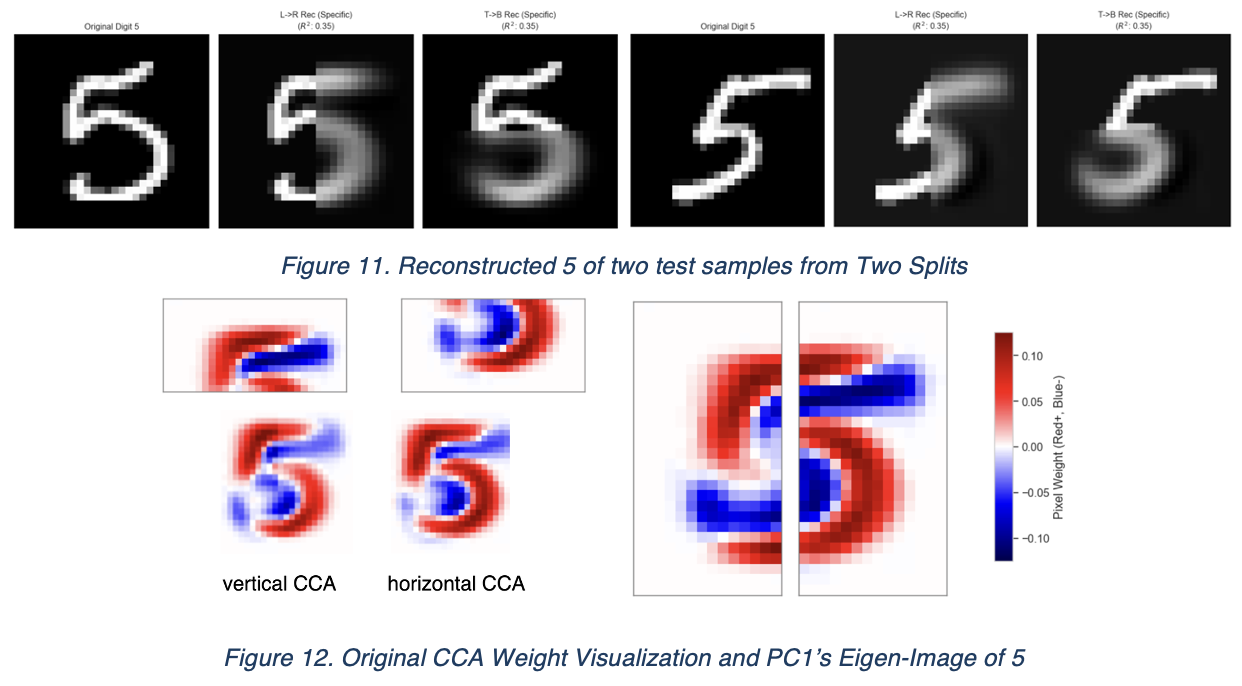
In terms of 5, we confirmed its PC1 for both vertical and horizontal, is the difference in spatial position. That explained why their dependencies are surprisingly identical. 5 contains both “not differentiable” angle and an arc on the bottom. The complexity of its geometric structure may contribute to its stabilities of dependencies across both splitting algorithms.
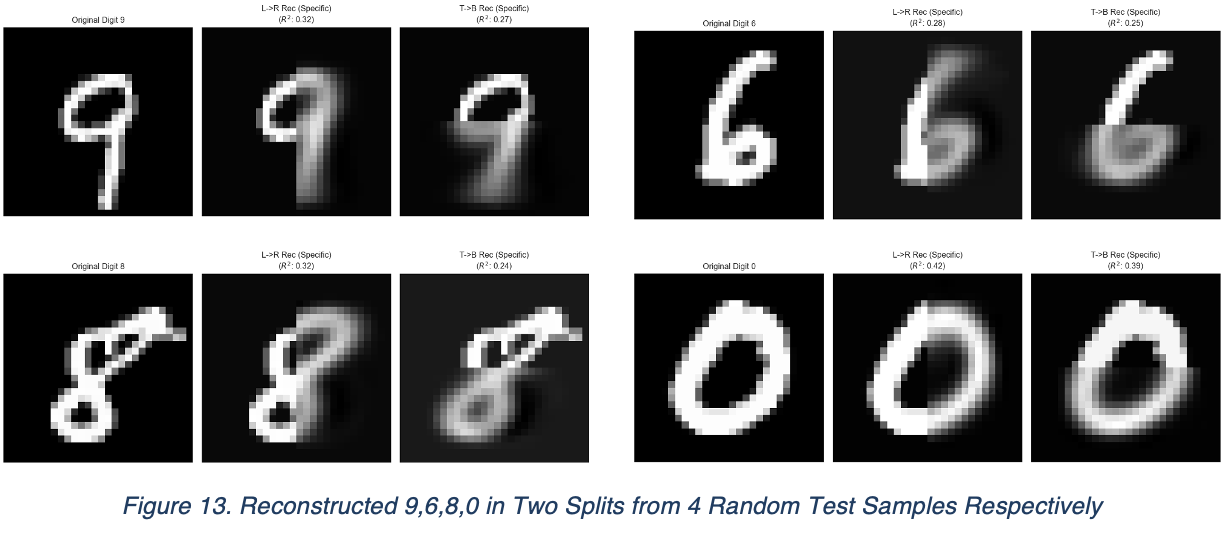
Same discoveries go for 0,6,9,8: they all contain ring and their dependencies are mainly surrounded by the “ring” structure. We verify these by using Linear Regression to restore their image from half, and they indeed restored some critical information, despite of only using 5 principle components.
However, for 4 and 7, the situation becomes a bit different. There are disconnections of lines as well as mixed patterns of blue and red in them. By inspecting their eigen-images of PC1 to PC5, they have shown a given sort of inconsistencies as well as the bar plot.
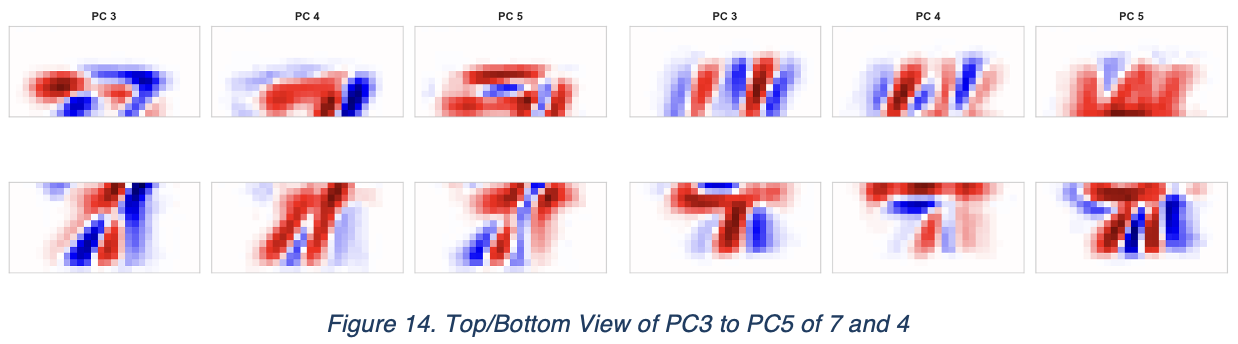
Some of its principal components seems overlapped, despite of PC1 and PC2 which indicates spatial position and thickness/volume of character, while theirs is not passing very clear information of what signature feature of these numbers are actually being examined. The patterns are mixed with both positive and negative values.
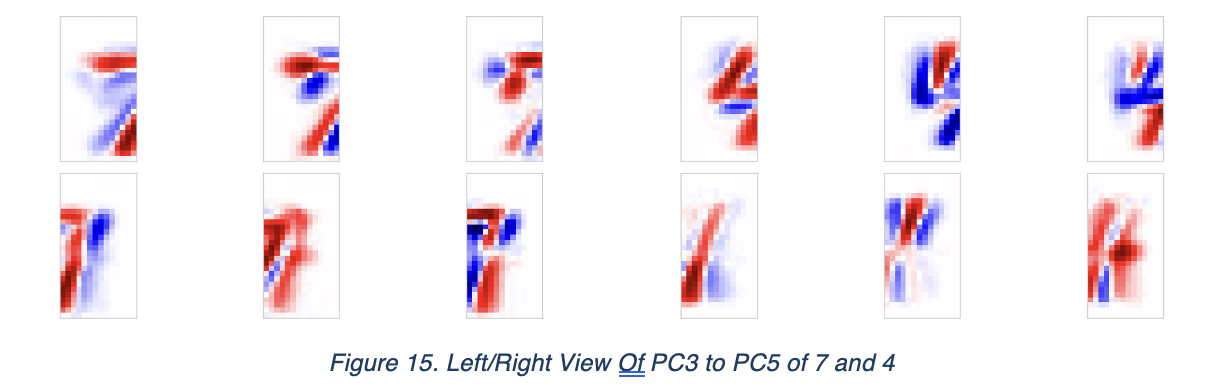
For the demonstration, we will only show the CCA weight for PCs of 7 here. PC1, PC3 and PC4 shown different trend across both pictures, while only PC2 and PC5 shown consistencies. Same for PC2, PC4, PC5 that has weight of same direction and opposite for PC 1 and 3.
However, if we see the spitted horizontal view of 7, we see both direction was dominated by PC1, but in different directions. This could explain why the patterns are mixed. Same phenomenon applies for 4.
We then proceeded to our next experiment to investigate the reason why, by only using the first principal component to execute the CCA and see how the resulted CCA reacts. By generating the CCA visualization of both views, we have the following figure.
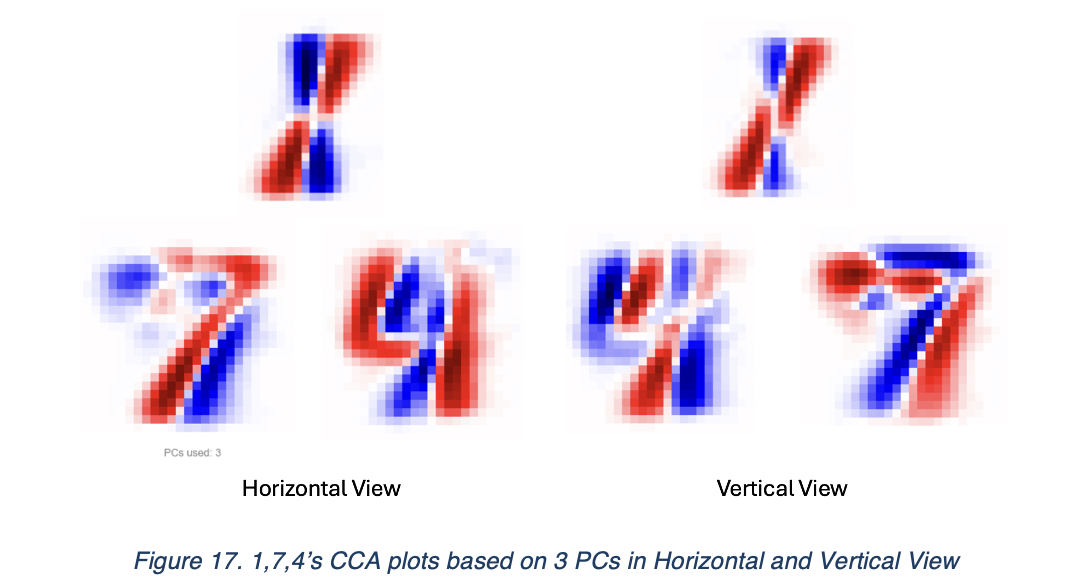
We see that 1,4,7 in this case, has become much more similar together. These three numbers have one feature in common: they are mainly formed by straight lines unlike other numbers. They also do not contain closed loop or arc for most of the writing style. While using Linear Regression to restore information, we saw huge differences from the restored image of different parts, as demonstrated below.
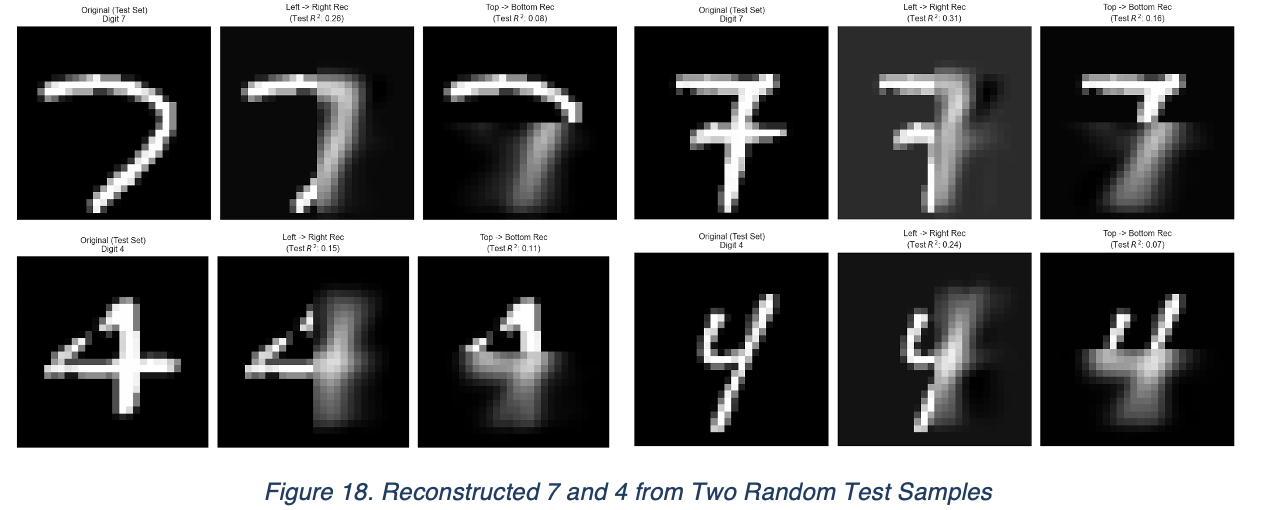
In this case, we suspect that numbers with these structures are harder to maintain the consistency of their part’s linear dependencies when more principal components were introduced. As suggested by these linear regressions, their shape and position are better preserved.
At last, we will be focusing on 2. This number shown the signature “arc” across all the CCA image, which we suspect it’s due to the variations between two writing styles of 2, as it varies according to 10 random samples selected below:
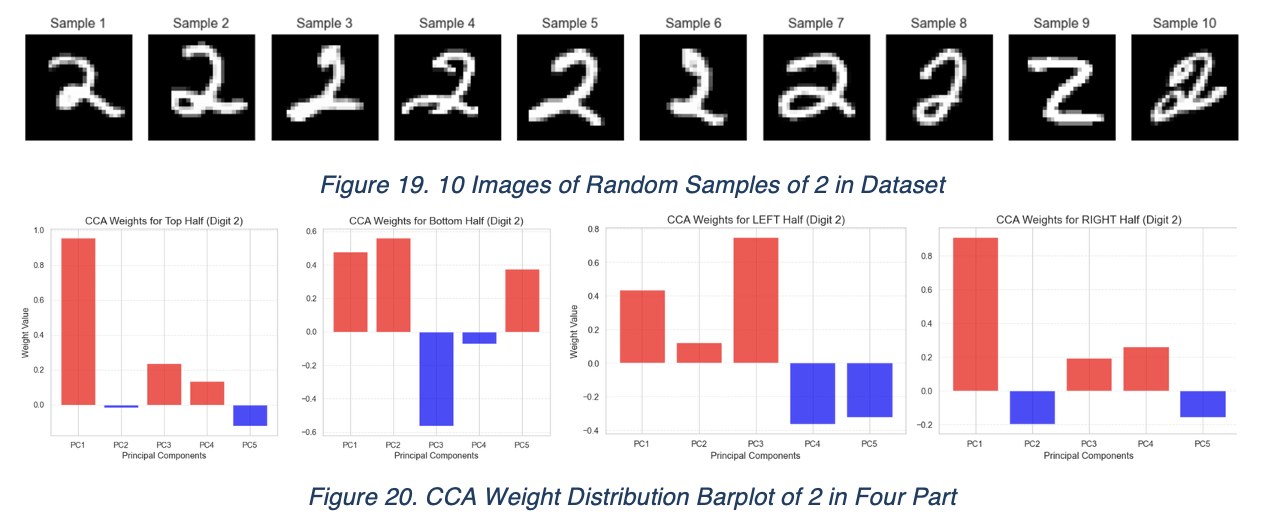
It’s especially interesting to see that the dominance of 2 is always one PC1 and the other from PC2 or PC3. In this case, the left PC2 and bottom PC3’s weight are very similar in absolute value, which is 0.559 and -0.563 respectively.
Upon checking the most dominant PCs and 2’s CCA images respectively, we found a pattern.
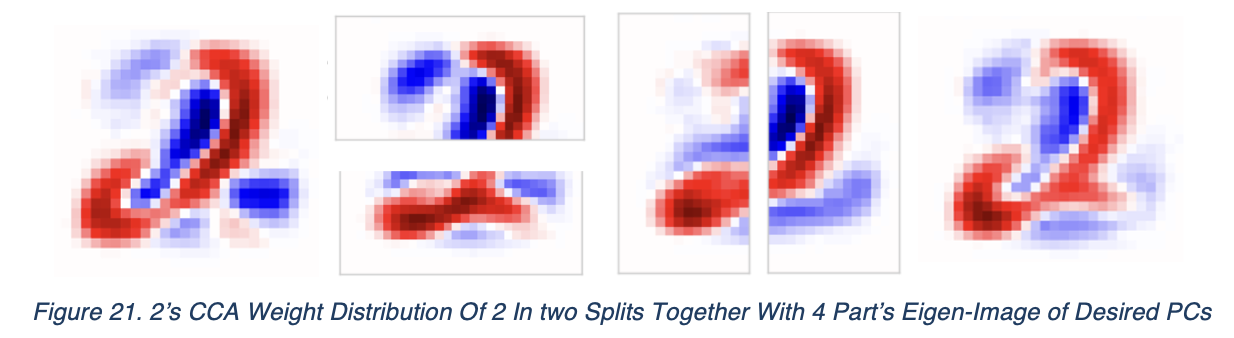
For the digit ‘2’, correlated principal components reveal that structural consistency is primarily driven by different writing styles. Specifically, PC1 through PC2/3 isolate a signature “arc” structure. The presence of this arc dictates the digit’s internal dependencies; without it, the dependency structure shifts significantly, indicating that the coherence of ‘2’ relies on distinguishing between these stylistic states.
As seen by the linear regression restored figure on next page, the “arc” gets preserved in both view.
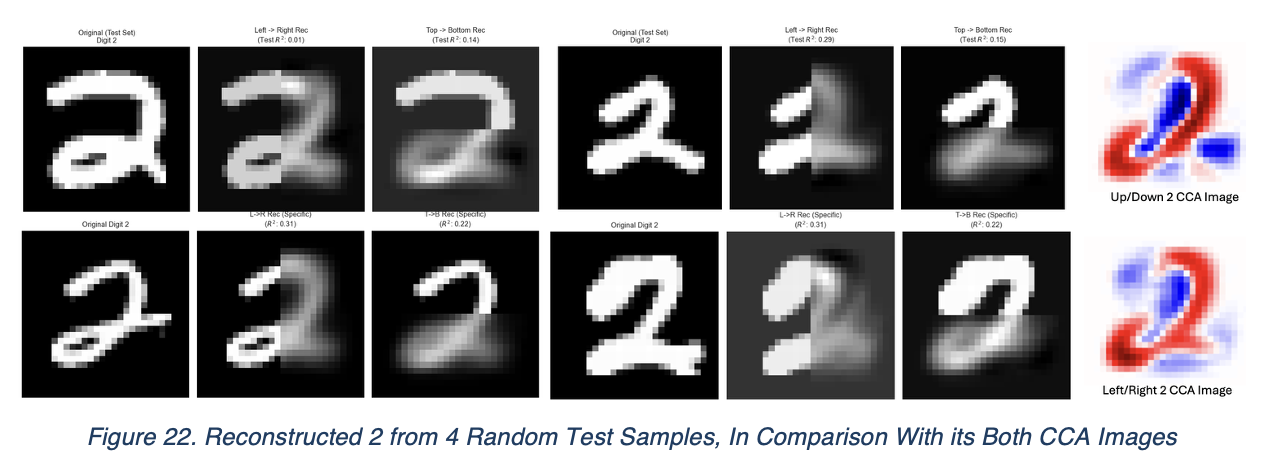
To summarize our discoveries, segmentation orientation fundamentally alters the features captured by CCA. Vertical segmentation tends to emphasize stylistic attributes such as stroke width and scale, whereas horizontal segmentation reveals stronger spatial dependencies.
Our hypothesis at the beginning of essay is verified after a series of experiments and analysis. Curvilinear digits (0, 3, 5, 6, 8, 9) exhibit robust linear dependencies focused on spatial structure, remaining stable even when higher-order PCs are introduced. Rectilinear digits (1, 4, 7), composed of straight lines and sharp vertices lack this stability, with vertical style focused and horizontal structure focused. Their part-to-part dependencies degrade more rapidly as more PCs are included, making it difficult to maintain structural consistency.
For digit 2, the dependencies mainly focused on the writing style and maintained stable across the structures, just like those curvilinear digits.
5. Discussions
5.1 Limitations
Our analysis relies on a subset of the MNIST dataset, which may limit the generalizability of the captured features compared to the full population. Also, our current approach overlooks complex topological relationships such as continuous deformations in digit structure by the nature that both CCA and our linear regression model are restricted to linear dependencies. Since we do not have further information about if there exists non-linear relationship within these numbers. Specifically, the linear regression used for reconstruction assumes a direct linear mapping between spatial partitions, failing to model the complex conditional distributions required to accurately predict highly irregular strokes is expected. While the model has successfully captured the global geometric trends that which aligns with our qualitative analysis. It still fails to predict exact pixel intensities. Specifically, the negative R^2 scores observed in some digits during experiment highlight the sensitivity of this metric to misalignment and blurriness inherent in linear low-dimensional reconstruction. More precision will help in unveiling more possible discoveries as we move the research forward.
Additionally, our spatial partitioning was limited to vertical and horizontal axes, we do not know the relationship of these dependencies in other modes of splits. Finally, while truncating analysis to the top five principal components mitigates high-dimensional noise, it discards relevant structural information encoded in lower-variance components, potentially simplifying complex digit representations.
5.2 Future Research Directions
Future research will extend this work by utilizing the complete MNIST dataset to ensure the generalizability of our findings. We plan to implement alternative partitioning algorithms, such as diagonal or non-linear splits. We will be proposing methods such as UMAP, to better capture non-linear topological structures that were missing in our current experimental design. Kernel PCA will also be employed to enhance clustering accuracy and interpretability in high-dimensional spaces. Finally, to surpass the predictive limitations of linear regression observed in this study, we aim to adopt Neural Networks, leveraging their universal approximation capabilities to model complex, non-linear dependencies between image segments more accurately.
This work is licensed under a Creative Commons Attribution 4.0 International License.